Lidar measurements within PollyNet of the aersol distributions in climatological key-regions
 at the GAW regional station Shangdianzi")
Fig. 1: Main air flow conditions (red arrows) at the GAW regional station Shangdianzi (SDZ).
Measurements in Asia
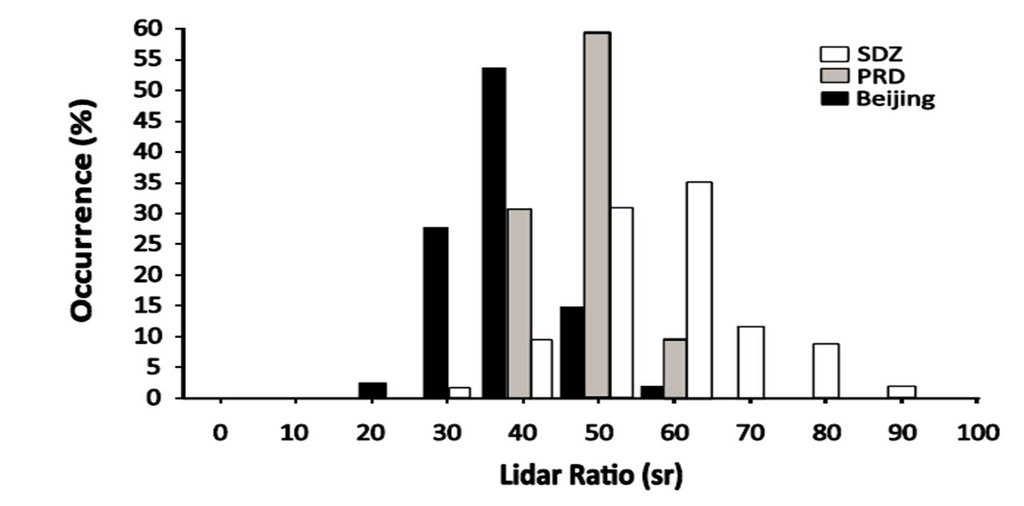
In October 2004 first Raman lidar measurement abroad with Polly were performed at Xinken (22.6N, 113.6E), Pearl River Delta (PRD), China. Haze layers were observed up to 1.5-3km height during the diurnal cycle. The particle optical depth (532nm) ranged from 0.3–1.7 and was, on average, 0.92. The haze–layer mean extinction–to–backscatter ratio was 35 to 59sr, on average, 47sr (Ansmann et al., 2005, "High aerosol load over the Pearl River Delta, China, observed with Raman lidar and Sun photometer"). Lidar data inversion revealed particle effective radius of around 0.24µm, mean imaginary parts of around 0.02i and the single scattering albedo as low as 0.75 at 532-nm wavelength. (Mueller et al., 2006, "Strong particle light absorption over the Pearl River Delta (south China) and Beijing (north China) determined from combined Raman lidar and Sun photometer observations"). The lidar measurements were continued in Beijing, China in January 2005. Almost clean air masses were observed throughout the measurements of the Beijing campaign. These air masses originated from arid desert–steppe-like regions (greater Gobi area). Extinction values usually varied between 100 and 300 Mm-1, and the lidar ratios were considerably lower (compared with PRD values) with values mostly from 30 to 45 sr (average of 38sr). Gobi dust partly influenced the observations. Unexpectedly low lidar ratios of approximately 25 sr were found for a case of background aerosol with a low optical depth of 0.05 (Tesche et al., 2007, "Particle backscatter, extinction, and lidar ratio profiling with Raman lidar in south and north China", Inversion: Tesche et al., 2008, "Retrieval of microphysical properties of aerosol particles from one-wavelength Raman lidar and multiwavelength Sun photometer observations"). In 2009/2010 TROPOS returned to the area of Beijing, again. In the framework of the European Aerosol Cloud Climate and Air Quality Interactions (EUCAARI) project one-year Raman lidar observations of profiles of aerosol extinction and backscatter coefficients at 532nm were performed at the Global Atmospheric Watch (GAW LINK) station of Shangdianzi.
In the nighttime statistics a two-layer structure with the main haze layer reaching to 1–1.5 km height asl and an elevated aerosol layer on top with a top height of 2.5–5 km height asl was generally observed. During the passage of a strong haze front aerosol optical depth (AOD) and extinction coefficients increased from 0.2 to 1.2 and from 200 Mm-1 to 1000 Mm-1, respectively, within less than two hours. The statistical analysis revealed layer mean extinction coefficients of the haze layer most frequently from 200–600Mm-1 and typically from 50–100 Mm-1 in the elevated layer. The AOD ranged from about 0.3 for northerly air flows to, on average, 0.95 during southerly air flows. The extinction-to-backscatter ratio showed a narrow distribution peaking at 60 sr in the haze layer caused by anthropogenic fine-mode aerosol and a broad distribution from 40–90 sr in the elevated layer caused by the complex mixture of aged desert dust, biomass burning smoke, and industrial pollution over eastern Asia. (Hänel et al., 2012, "One-year aerosol profiling with EUCAARI Raman lidar at Shangdianzi GAW station: Beijing plume and seasonal variations").
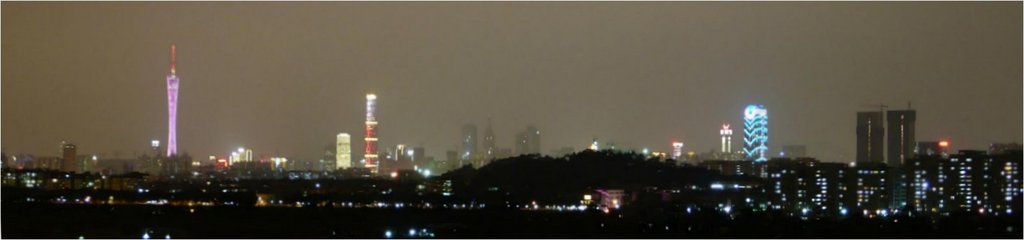
From October 2011 to July 2012, PollyXT measurements were conducted in Guangzhou in the Pearl River Delta (PRD) in the frame of the Megacities Project.
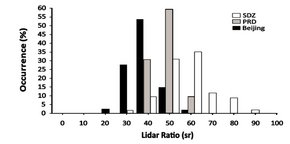
Fig. 3: Comparison of lidar ratios (for the entire aerosol layer up to AL top) measured in South China (Pearl River Delta, PRD, October 2004) and North China (Beijing January 2005, mostly cluster W cases, Shangdianzi, SDZ (2009/2010), this study).
The Observed AOD shows moderate values with monthly mean values around 0.55 in November and 0.50 in December. In January (AOD =0.64) and February (AOD = 0.84) it was often cloudy or rainfall prohibited the measurements. This seems to be triggered by a La Niña event during that winter. In March the highest monthly mean of 1.08 was observed. Towards the rainy season the mean AOD decreases to 0.87 in April and 0.49 in May. The mean AOD for the whole observation period was 0.68, which indicates generally a high atmospheric particle load. From November to April the Ångström exponent remains on a high level between 1 and 1.5. The mean value is 1.26. This can be regarded as a kind of background value for this period and indicates that the observed particles were dominated by urban aerosol. During the more rainy summer season from May to June the Ångström exponents were lowering with a mean value of 0.89 (Heese, ILRC, 2012)
Further west, at Gual Pahari, close to New Delhi, India multiwavelength Raman and polarization lidar measurements with the PollyXT of the Finish Metrological Institute(FMI) were performed within EUCAARI in 2008/2009 as well. The measurements revealed that, on average, the aerosol layer was at its highest in spring (5.5 km). In summer, the vertically averaged (between 1–3 km) backscatter and extinction coefficients had the highest averages (3.3Mm−1 sr−1 and 142Mm−1 at 532 nm, respectively). Aerosol concentrations were slightly higher in summer compared to other seasons, and particles were larger in size. The autumn showed the highest lidar ratio and high extinction-related Angstroem exponents, indicating the presence of smaller probably absorbing particles. The winter had the lowest backscatter and extinction coefficients, but the extinction-related Angsroem was the highest, suggesting still a large amount of small particles. (Kompulla et al., 2012, "Technical Note: One year of Raman-lidar measurements in Gual bPahari EUCAARI site close to New Delhi in India – Seasonal characteristics of the aerosol vertical structure").
First Raman lidar measurements in the Amazon Basin
First multiwavelength polarization Raman lidar observations of optical and microphysical particle properties over the Amazon Basin (60km north of Manaus, Brazil (2.5S, 60W) ever were conducted in the Amazon rain forest from January to November 2008. These measurements were performed in the framework of EUCAARI, too. Figure 4 shows the measurement site during day and night time. The measurements covered the wet season (Dec–June) and the dry/burning season (July–Nov). Biomass burning aerosol showed a broad spectrum of optical, microphysical, and chemical properties. The statistical analysis of the entire measurement period revealed strong differences between the pristine wet and the polluted dry season. African smoke and dust advection frequently interrupt the pristine phases during the wet season.

Fig 4: Polly-XT in the Amazonian forest north of the city of Manaus, Brazil
Smoke and Dust from Africa reaches the Amazon basin
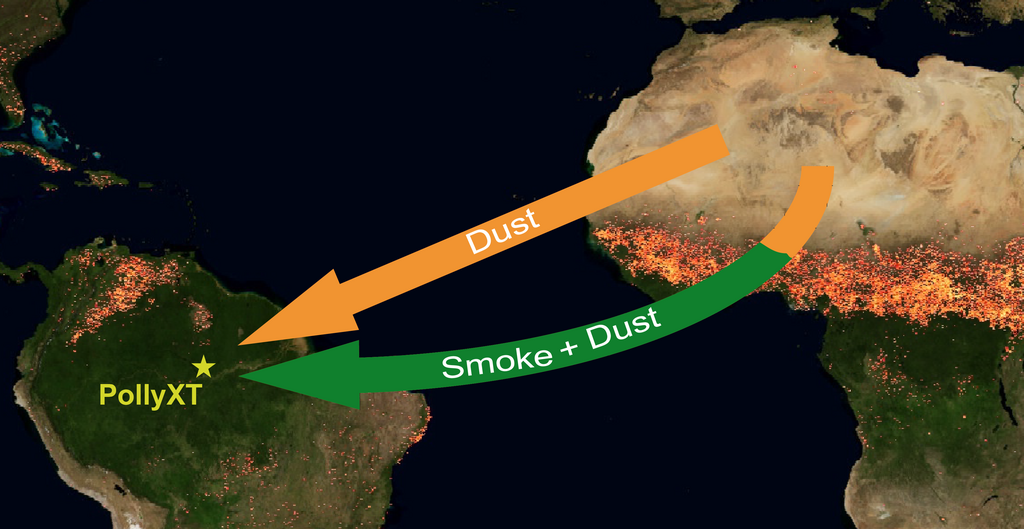
At Manaus in about one third of all lidar measurements during the wet seasonadvection of smoke and dust aerosol from Africa were observed. The contribution of African smoke and Saharan dust particles to the total backscatter and extinction coefficient was determined by means of the measured particle depolarization ratio. A decreasing contribution of smoke particles to the total particle extinction coefficient from values around 60%–80% in January and February 2008, to values of 0%–50% in May 2008 was observed. Smoke–related extinction coefficients and optical depths up to 80 Mm−1 and 0.15 at 532 nm, respectively, were recorded. (Baars et al., 2011, "Further evidence for significant smoke transport from Africa to Amazonia")

Fig 5.
Fig. 5: Schematic illustration of aerosol transport from Africa toward the Amazon Basin during Amazonia’s wet season. The star indicates the location of PollyXT. The underlying fire map shows the monthly composite of MODIS fire counts (red, orange, and yellow spots) for February 2008 (source: NASA’s Earth Observatory link).
Quasi-simultaneous, vertically resolved multiwavelength aerosol Raman lidar observations were performed at Praia, Cape Verde (15N, 23.5W). Thus, coincident observations in the near and far field of the transatlantic transport of African dust and biomass-burning aerosol were conducted. A detailed characterization of aerosol properties, vertical stratification, mixing, and aging behavior during the long-distance travel in February 2008 (dry season in western Africa, wet season in the Amazon basin) showed highly stratified aerosol layers of dust and smoke up to 5.5 km height were found close to Africa, while the aerosol over Manaus was almost well-mixed after the transatlantic transport, reached up to 3.5 km, and mainly consisted of aged biomass burning smoke. (Ansmann et al., 2009, "Dust and smoke transport from Africa to South America: Lidar profiling over Cape Verde and the Amazon rainforest").
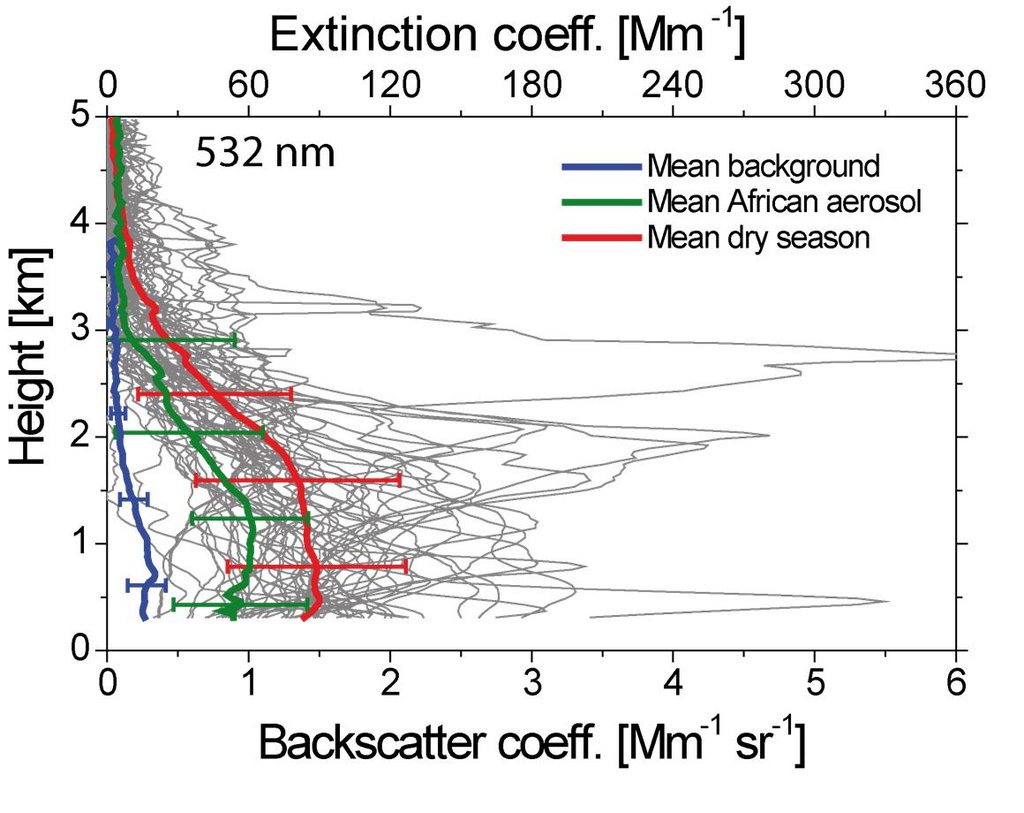
Under pristine conditions, the particle extinction coefficients and optical depth for 532 nm wavelength were frequently as low as 10–30 Mm-1 and <0.05, respectively. During the dry season, biomass burning smoke plumes reached to 3–5 km height and caused a mean optical depth at 532 nm of 0.26. On average during that season, particle extinction coefficients (532 nm) were of the order of 100 Mm-1 in the main pollution layer (up to 2km height). Ångström exponents were mainly between 1.0 and 1.5, and the majority of the observed lidar ratios were between 50–80sr (Baars et al., 2012, "Aerosol profiling with lidar in the Amazon Basin during the wet and dry season"). Compared to pristine wet season conditions, the particle scattering coefficients in the lowermost 2 km of the atmosphere were found to be enhanced, on average, by a factor of 4 during periods of African aerosol intrusion and by a factor of 6 during the dry (burning) season.

Fig 6.
Fig. 6: Mean profiles (thick solid lines) with standard deviations (thick bars, indicating the atmospheric variability) of the 532 nm particle backscatter coefficient for background conditions in the wet season (blue), conditions with African aerosol advection during the wet season (black), and as observed during the dry season (red). All individual profiles (thin grey lines) measured during the dry season are shown in addition to illustrate the strong variability and vertical inhomogeneity of smoke contamination during the burning season. Extinction scale (upper axis) is simply given by multiplying the backscatter scale with a lidar ratio of 60 sr.

Fig. 7: Map of the three meridional transatlantic cruises
of Polarstern.
Measurements in Africa
Atmospheric lidar measurements were carried out by the FMI at Elandsfontein measurement station, on the eastern Highveld approximately 150km east of Johannesburg in South Africa (SA) throughout 2010. The height of the planetary boundary layer (PBL) top was continuously was investigated (Korhonen et al., 2013, ACPD). The PBL top height was detected 86% of the total measurement time (42% of the total time). Large seasonal and diurnal variations were observed. On average, the PBL top was highest in spring (September and October with heights of 2170 and 2260m, respectively), while it was the lowest in winter (May–August with heights of 1450–1790m) and in December. PBL growth rates were highest in spring with 220 ±100 m/h and lower during the other seasons. On average, growth rates between 100 and 300m/h were found.
Ship cruises on the Atlantic for north-south cross sections of aerosol distribution
The applibility of the Polly systems was extended to shipborne measurement station since 2009. Lidar observations were performed aboard the research vessel Polarstern in 2009 and 2010 during three north-south cruises from about 50N to 50S.
Fig. 8
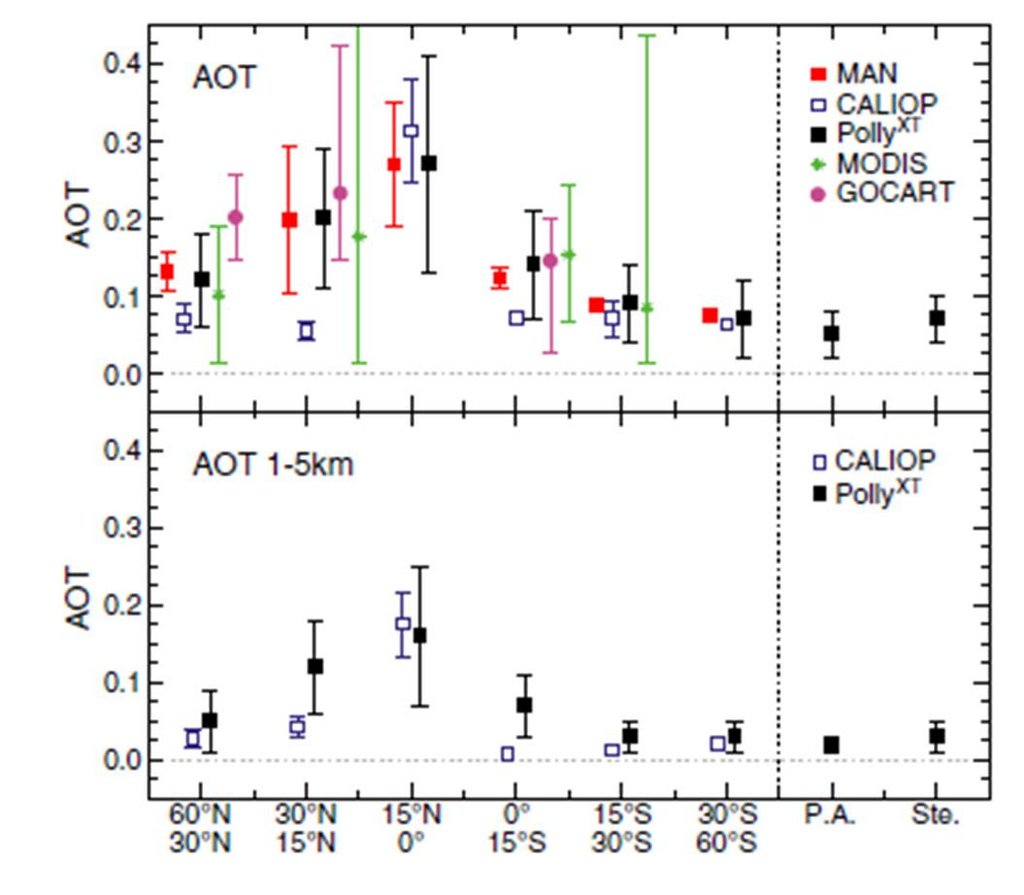
Fig 8.: Mean AOT at 532 nm for different latitudinal belts derived from PollyXT observations during three transatlantic cruises of Polarstern in 2009 and 2010 (black), from CALIOP overpasses (532 nm, blue) during Polarstern observations, and from MAN Sun photometer observations (500 nm) above the Atlantic from 2004–2011 (red), compared to MODIS satellite observations [Kaufman et al., 2005] (green), and AOT values modeled with GOCART (pink) [Chin et al., 2002]. Error bars show the range of measured AOTs (standard deviation for MAN, PollyXT, CALIOP observations). Exact latitudinal ranges are given in the text. (Bottom) Mean AOT at 532 nm from PollyXT observations and CALIOP observations for the height range from1 to 5 km height (free troposphere). P.A. and Ste. Denote the measurement sites at Punta Arenas (53ıS), Chile and Stellenbosch (34ıS), South Africa.
Concerning the contrast between the anthropogenically influenced midlatitudinal aerosol conditions in the 30–60N belt and the respective belt in the southern hemisphere over the remote Atlantic, it is found that the AOT and extinction coefficients for the vertical column from 0–5 km (total aerosol column) and 1–5 km height (lofted aerosol above the marine boundary layer) are a factor of 1.6 and 2 higher at northern midlatitudes than at respective southern midlatitudes, and a factor of 2.5 higher than at the clean marine southern-hemispheric site of Punta Arenas. The strong contrast is confined to the lowermost 3 km of the atmosphere. (Kanitz et al., 2013, "North-south cross sections of the vertical aerosol distribution over the Atlantic Ocean from multiwavelength Raman/polarization lidar during Polarstern cruises".

Fig. 9: Polly-XT in Finland.
 at the GAW regional station Shangdianzi")