Back-tracking method
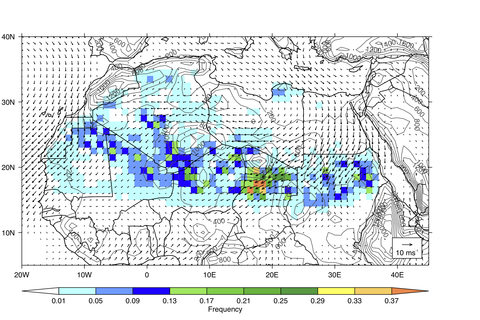
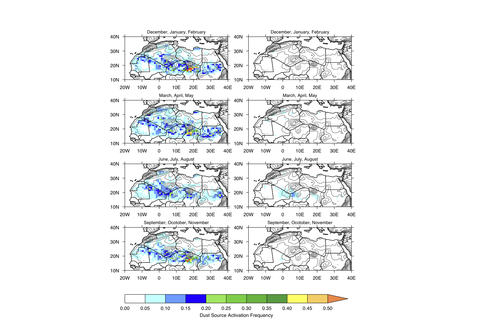
For the back-tacking method, observations from a geostationary satellite such as the infra-red dust index compiled from 15-minute SEVIRI observations are analysed in order to identify individual dust plumes. These plumes are then tracked back in time and space to the point of origin, the point where the dust plume appears for the first time. This place can be assumed to be the initial dust sources. This way, the locations of active dust sources are compiled to a 1° × 1° grid with a temporal resolution of 1 hour. Analysing individual months, seasons, years or even multi-year periods, dust source activation frequencies (DSAF) in terms of how often a grid-cell is identified as active (emitting) dust source can be inferred as shown in Figure 1 for the period March 2006 to February 2010. Besides the Bodélé depression (Chad), which is a dried-out paleo-lakebed, mountain foothill regions are characterised as frequent dust source region. Due to the hourly temporal resolution, the data set further allows to infer the diurnal cycle of dust source activations that implicitly provides information on the meteorological processes forcing the activation of the dust sources and thus dust entrainment. As illustrated on Figure 2, the majority of dust source activations occur during the morning hours. The fraction of dust source activations that are observed during the second half of the day is minor, but shows an increased significance during the monsoon season from June to August. Morning dust source activations are dominantly caused by the breakdown of the nocturnal low-level jet (LLJ) that leads to suddenly increasing surface wind speeds during the morning hours after sunrise. Afternoon and nighttime dust events are mainly related to deep moist convection and resulting gust fronts.
Threshold-frequency method
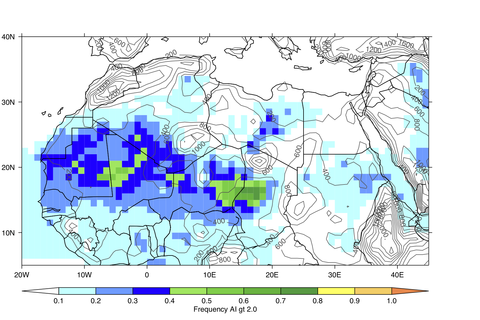
The threshold-frequency method is based on the assumption that high atmospheric dust loadings occur over active dust source regions. Thus, frequencies in dust loading, e.g. expressed by the aerosol optical depth (AOD) or the aerosol absorbing index (AI), that exceed a pre-defined threshold can be used as indicator for dust source regions. The threshold needs to be chosen in a way to exclude hazy background conditions. This method is commonly applied to inferred dust source regions from daily satellite dust products such as MODIS DeepBlue, OMI AI, or TOMS AI. As for the back-tracking method, occurrence frequencies for a set period illustrate the dominance of individual dust source regions in terms of their activation frequencies as shown in Figure 3 for OMI AI fields. Applying this approach, in particular topographic depressions and basin structures are highlighted as frequent dust source regions such as the Erg Djouf in Mauritania, or the Bodélé and Ténéré depression in Chad and Mali.
Figures 1 and 3 are showing dust source maps retrieved from two different satellite instruments (SEVIRI and OMI) applying the back-tracking method and the threshold-frequency method, respectively. Comparing the hot-spot regions in terms of frequent occurrence of dust source activation, a spatial shift in down-wind direction is evident. This can be explained by the time lag between the start of dust emission (morning hours) and the satellite overpass at 1.45pm. During this time, suspended dust is transported within the airflow. Thus, dust source locations inferred from satellite observations on a daily resolution implicitly include a dust transport component that depends on the time lag between initial dust source activation and observation. This needs to be kept in mind when analysing the spatial distribution of active dust source regions.
The annual and seasonal mean dust source activation frequencies (DSAF) data can be downloaded here.
References
Schepanski et al. (2007) Schepanski, K., I. Tegen, B. Laurent, B. Heinold, and A. Macke (2007), A new Saharan dust source activation frequency map derived from MSG-SEVIRI IR-channels, Geophys. Res. Lett., 34, 18803, doi:10.1029/2007GL030168.
Schepanski et al. (2009) Schepanski, K., I. Tegen, M. C. Todd, B. Heinold, G. Bönisch, B. Laurent, and A. Macke (2009), Meteorological processes forcing Saharan dust emission inferred from MSG-SEVIRI observations of sub-daily source activation and numerical models, J. Geophys. Res., 114, D10201, doi:10.1029/2008JD010325.
Schepanski et al. (2012) Schepanski, K., I. Tegen, and A. Macke (2012), Comparison of satellite based observations of Saharan dust source areas, Rem. Sens. Environm., 123, 90-97, doi:10.1016/j.rse.2012.03.019.


