The Role of Cloud Turbulence
Clouds are well known to be a highly turbulent system with different cloud processes are influenced or even controlled by the turbulent velocity and thermodynamic field.
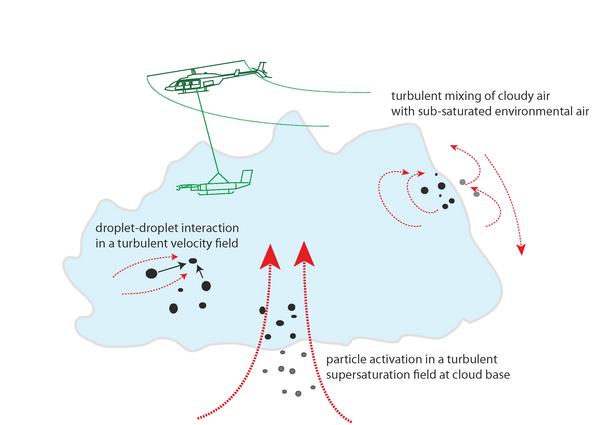
In the figure above, selected turbulent processes are illustrated for a shallow cumulus cloud which are discussed in the following:
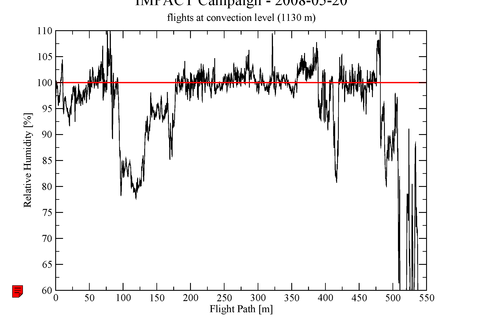
- In the early state of cloud development aerosol particles are activated and form cloud droplets when saturation at cloud base is reached. The saturation field depends non-linearly on the turbulent temperature and humidity fields, that is, locally increased fluctuations of super-saturation are expected. Unfortunately, the direct observation of super-saturation with high spatial resolution and high precision at cloud base still remains a measurement challenge and local peak super-saturations have never been directly measured so far. During the IMPACT campaign accomplished in 2008 in the Netherland it was possible to perform measurements with ACTOS just during the onset of shallow cumulus convection. Figure 1 shows the relative humidity derived from temperature and absolute humidity observations for a 550m-long flight path. The absolute value was shifted to achieve a mean relative humidity of 100% for in-cloud observations. Strong humidity fluctuations around cloud base are the most obvious feature of the time series although the amplitude itself has to be confirmed by further calibration effort.
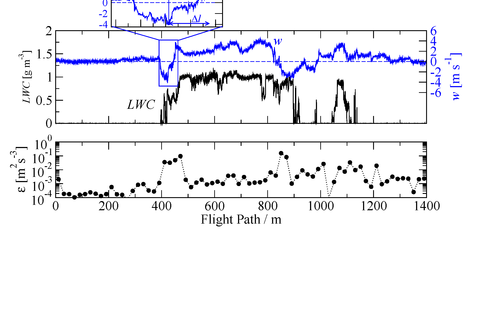
- At cloud edges often increased turbulence can be observed caused by strong shear resulting from updrafts in the cloud core region and adjacent downdrafts at the cloud edge. These frequently observed downdrafts are also called subsiding shells which are caused by evaporative cooling of cloud droplets resulting in negatively buoyant air around the cloud. Large-scale shear effects and the local release of latent heat induce increased turbulence at cloud edges, which is often even stronger compared to the cloud core region. This strong turbulence in turn will enhance effective mixing of cloudy air parcels with sub-saturated environmental air. Figure 2 shows ACTOS measurements including a cloud penetration indicated by values of the liquid water content LWC up to 1 g m-3. The vertical velocity w shows updrafts of up 4 m s-1 in the cloud core region and shallow downdraft regions of up to –4 m s-1 at cloud edges. The enlarged picture illustrates the strong shear at the left cloud edge where w increases from -4 to +4 m s-1 over a horizontal distance of 35 m. The lower panel shows the local energy dissipation rate averaged over 20 m. This parameter is considered as a measure of turbulence intensity and shows clear maximum values at cloud edges due to the strong shear.
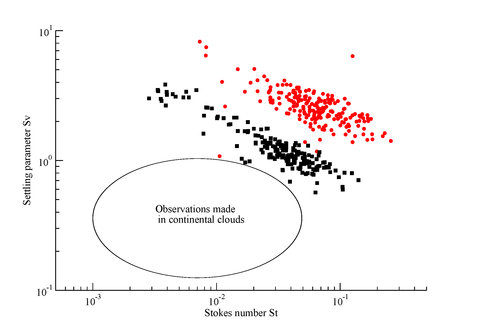
- Small-scale turbulence and gravity are the two driving forces when it comes to droplet-droplet interaction such as the collision-coalescence process. Whereas in weakly turbulent clouds pure gravity might be the dominant force on droplets, in more convective clouds the intermittent character of turbulence has the potential to compete with gravity. This is particular true for larger droplets with increasing inertial droplet response to the turbulent velocity field. Therefore, relative motion of two droplets – which is crucial for collision - arises from gravitational settling of droplets with different sizes and differences of the turbulent velocity at the droplet location. The dimensionless parameter space that indicates the relative importance of the two forces on individual droplets is shown in Fig. 3. Here, a high Settling parameter means that gravitational settling is dominant and high Stokes numbers indicate an increasing influence of local turbulence.


