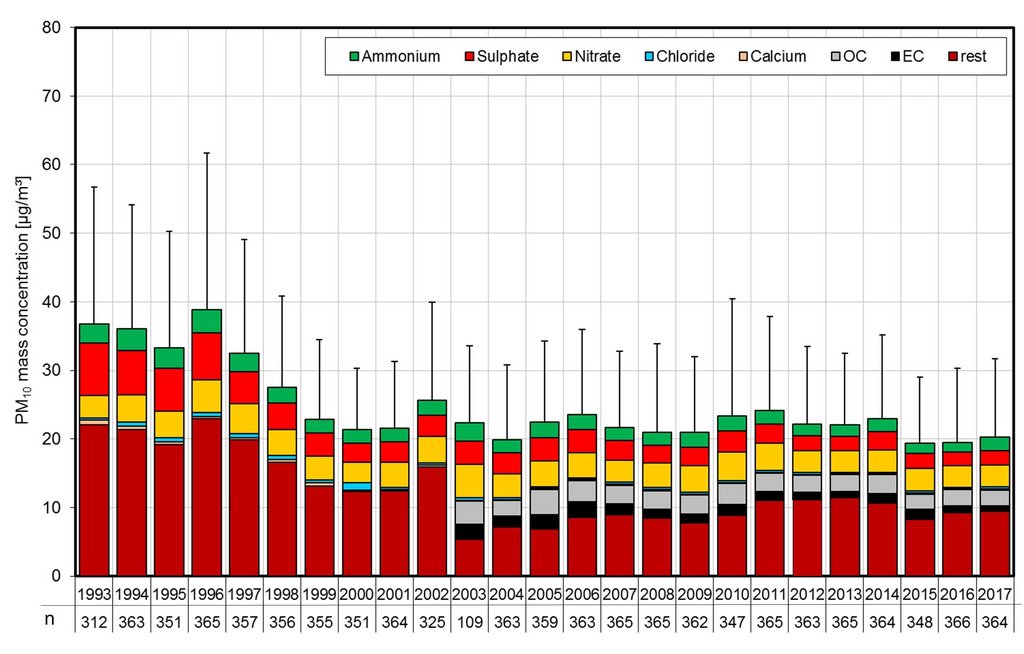
The results of long-term sampling and characterization of particles are shown in the graph as bars of yearly means. The particle mass concentration PM10 decreased from 1993 until 1999 and since then remained constant (mean about 21.9 µgm-3) with an absolute inter-annual variability of about ± 1.3 µgm-3 (corresponding to 6% of PM10). The decreasing PM10 concentration (1993 until 1999) was caused by decreasing primary local emission from old industry and inefficient power stations (dating from times of the former GDR in the eastern part of Germany). The decreasing number of individual coal stoves in the surrounding settlements reduces the primary emission of PM also. Since 1993 the influence of long-range transport of PM and gaseous precursors therefore became more apparent. Nowadays, this is a major cause for distinctive high PM episodes in wide regions of Saxony, especially in winter. For the years 2010 until 2014, slightly higher mass concentrations PM10 were measured. The reason could be found in cold winter episodes with higher emissions from combustion processes and long-range transport of polluted continental air masses from the East. The lowest yearly mean value (19.4 µgm-3) for the particle mass concentration PM10 was detected in 2015.
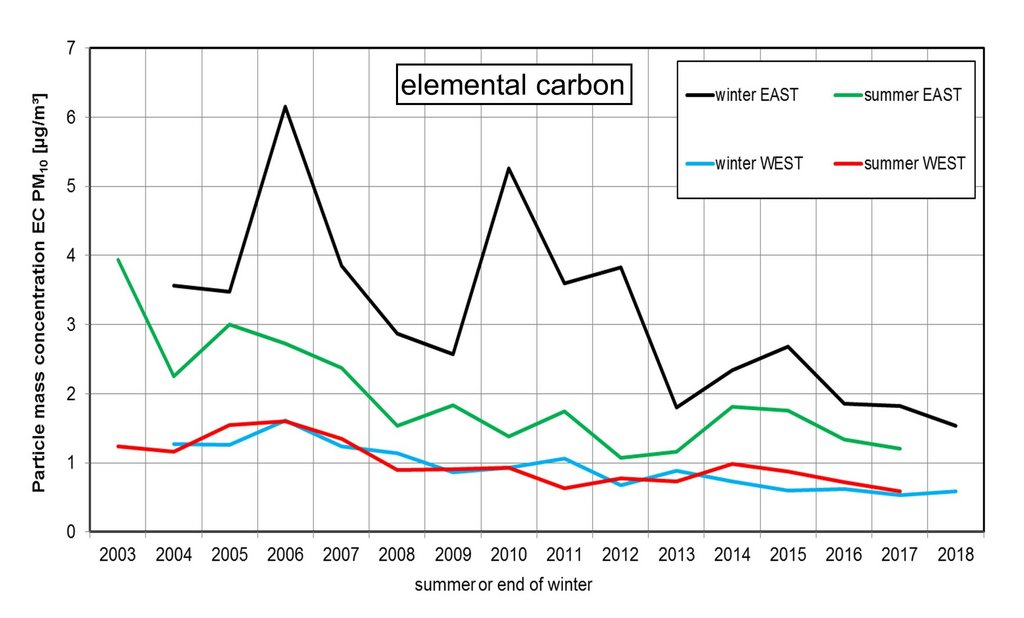
The trends for the mean concentrations of elemental carbon in summers (May-October) and winters (November-April) distinguished for an air-mass inflow from a sector West or East are shown in the next figure. The mean concentration shows for the four cases a decreasing trend. The highest EC-concentrations were found for a continental air-mass inflow (sector East). A reason is long-range transport of emissions from individual coal fired ovens. The strong pattern of the mean values was triggered for a continental air-mass inflow in winter by the different “meteorological” character of the winters. The also slightly decreasing trend of the EC-concentration in summer for an air-mass inflow from sector East can be caused by lower industrial EC-emissions year by year in the source regions.